Analysis of spatial and attribute data
Analysis of Attribute Data
- Attribute data analysis refers to the analysis of description of map items to generate new information.
- It is done for following purposes:
1. Classification (identify whether a set of feature belong to a group or not)
2. Retrieval (selective search such that output does not need modification of the features)
3. Generalization (reduce level of classification detail to make pattern more apparent)
4. Verification (checking values of attributes against real values)
Analysis of Spatial Data
- Spatial analysis refers to the analysis of the spatial data related to the geographic phenomena used for evaluating suitability, prediction, estimation and interpretation.
- It involves various operations to coordinate and relate the attribute data.
- It is used to find solution to the problems related to geographic decisions.
- The analysis leads to some new information that helps in decision making.
Measurements:
- The measurement like length, area and perimeter can be obtained by the help of spatial data analysis.
- It depends the type of GIS used and method of measurement employed.
- All the measurements are just the approximation to the real world values.
Proximity:
- Proximity function measures the distance between the features.
- Distance function is used to calculate a surface representing the distance to the nearest target in the raster data.
Spread Function:
- It moves outward step by step from target and calculates a variable at each step.
- Distance is only factor for spread function.
Neighborhood Function:
- It is used to examine the neighborhood around a target.
- The neighborhood being examined is known as window.
Vector and Raster overlay operators
Vector Overlay Operators
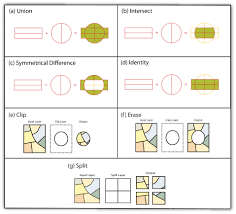
1. Union
- It is used when we want to overlay two polygon layers so that the resulting output layer has the combined attribute data of the polygons in the two inputs.
- It contains all the polygons from the inputs, whether they overlap or not.
- It produces a new layer with combined features and attributes of two polygon layers.
2. Clip
- It is used when we want to cut out a piece of one layer using one or more polygons in another layer.
- The features contained by the output is same as the features in the layer being clipped.
3. Dissolve
- It is used to aggregate the features based on a specified attribute.
4. Intersect
- It is used to produce the combined overlapped output from the two polygons.
- The output contains features of both polygons, but only the portion which are overlapped.
5. Erase
- It is used to remove a portion from the layer.
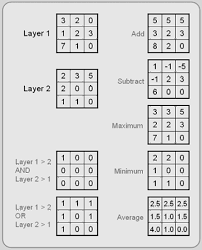
Raster Overlay Operators
- Raster overlay operation is also known as map algebra and requires that the two raster layers undergoing overlay operation must have same cell size.
- The various overlay operation are:
1. Addition
2. Subtraction
3. Multiplication
4. Division
5. Maximum
6. Minimum
7. Average
Overlay
- Overlay is one of the common spatial analysis tool that allows the users to identify areas where features in two layers overlap.
- It results in a new data set creation.
Question (2065 Baishakh)
Develop resulting attribute table when the following district road network is topologically overlaid on the district area map as shown with the given attributes.
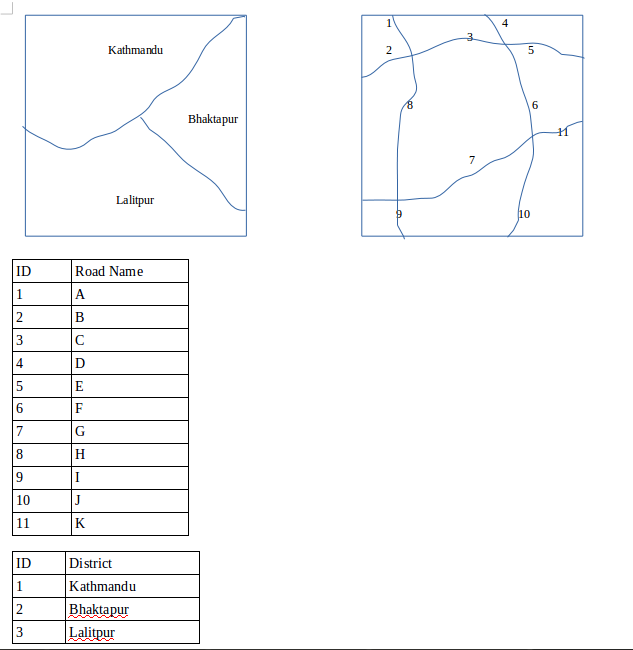
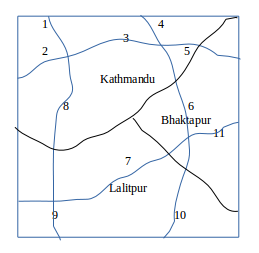
Solution:
The resulting overlay output is shown in figure given below.
The resulting attribute table is:
ID             District           Road Name
1             Kathmandu           A
2             Kathmandu           B
3             Kathmandu           C
4             Kathmandu           D
5             Kathmandu           E
6             Kathmandu           F
7             Kathmandu           H
8             Bhaktapur             E
9             Bhaktapur             F
10           Bhaktapur            G
11          Bhaktapur             J
12          Bhaktapur             K
13          Lalitpur                 G
14          Lalitpur                 H
15          Lalitpur                 I
16          Lalitpur                 J
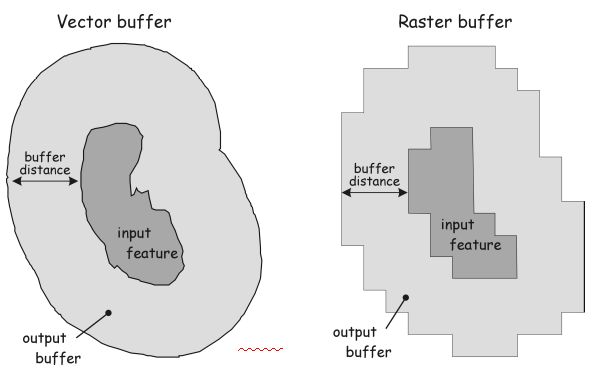
Buffering
- Buffer is one of the common spatial analysis tool.
- It is used for specific distance representation around a feature.
- The buffer operation creates a new polygon data sets.
- It goes outwards from the lines or areas.
- Buffering process constructs polygons containing all areas within a certain distance of the target.
- It is often combined with overlay to tabulate areas inside the buffers
Concepts of Spatial Data Mining
- Spatial data mining is the application of data mining to spatial models.
- It is defined as the data mining tools and techniques used to discover hidden patterns from the spatial data or spatial models.
- The spatial data or information is used to produce business intelligence.
- The main aim of spatial data mining is to distinguish the information so as to build real, actionable patterns to present, excluding the irrelevant results such as statistical coincidence.
Visual Variables for Spatial Data
1. Size (size of individual symbols, width of lines, size of symbols in an area)
2. Shape (shape of individual symbols, pattern symbols in lines and areas)
3. Brightness (brightness of symbols, lines or areas)
4. Color (Color used for symbols, lines or areas)
5. Orientation (Direction of individual symbols or patterns in lines and areas)
6. Spacing (space between patterns in symbols, lines or areas)
7. Perspective height (perspective 3 dimensional view of an object with the data value mapped to the perspective height of the points, lines or areas)
8. Arrangement (arrangement or distribution of patterns)
Scale Types
1. Nominal scale
- Categories are nominated class.
- There is no inherent order between categories.
- It is impossible to distinguish categories as superior or inferior.
- Eg: sex (male/female)
2. Ordinal scale
- Categories can be logically arranged in a meaningful order.
- The difference between categories is not meaningful.
- Eg: Ranks (1st/2nd/3rd)
3. Interval scale
- The values not the categories, can be ordered and have a meaningful difference, but doubling is not meaningful.
- Eg: Celcius scale
4. Ratio scale
- The values can be ordered, have a meaningful difference and doubling is also meaningful.
- There exists an absolute zero.
- Eg: Kelvin scale, weight
Qualitative and Quantitative data visualization
Visualization of Point
- Point data are discrete in nature, but may describe a continuous phenomena.
- Discrete data occurs at distinct locations while continuous data are defined at all locations.
- Smooth data refers to data that change gradually while abrupt data refers to data that change suddenly.
Dot Maps:
- Point can be visualized by placing a symbol or pixel at a location where the phenomena occurs.
- The quantitative parameters may be color or size of the point.
- On drawing large data sets on a map, there occurs a problem of overlap or overplotting of data points in highly dense areas.
- An approach to cope with such highly dense data is the use of 2.5 D visualization showing data points aggregated up to map regions.
Pixel Maps:
- It is same as the dot maps, but the overlapped pixels are repositioned.
Visualization of Line
- The basic representation of linear phenomena involves representation by line segments between pairs of endpoints specified by longitude and latitude.
- The quantitative parameters involved are line width, line color, line pattern and line labeling.
- The lines may not be straight.
Visualization of Area
Choropleth Maps:
- The values of an attribute or statistical value are encoded as colored or shaded regions on the map.
- The main problem is that the interesting values with less density is represented by barely visible polygons.
- It is used when the attribute has a partitioning distribution.
Dasymetric Maps:
- It is used when the attribute has a distribution other than partitioning into regions.
- The variables to be shown forms areas independent of the original regions.
Isarithmic Maps:
- It shows the contours of some continuous phenomena.
- It involves interpolation of the data points to obtain smooth contours.
Map outputs and its basic elements
- Output is the final product of any analysis.
- The most common form of output is map.
- The non-carthographic forms of output includes tables and charts.

Ⓒ Copyright ESign Technology 2019. A Product of ESign Technology. All Rights Reserved.