Different methods of data capture
- Data capture is the process of acquiring the data necessary for the GIS system about the geographic phenomena of interest.
- There are mainly two methods of data capture:
1. Primary Data Capture
2. Secondary Data Capture
Primary Data Capture
- This method captures data specifically for use in GIS.
- The raster data are captured through remote sensing.
- The vector data are captured through GPS measurement and surveying.
Secondary Data Capture
- This method captures data from the data that are collected for other purposes.
- The raster data are collected by scanning the existing maps or aeriel photographs.
- The vector data are collected through digitizing and photogrammetry.
- Photogrammetry is the science of taking measurements from the photographs.
Methods of Data Input:
- Data input is the process of encoding collected data into computer readable form and inserting the encoded data into the GIS database.
The different types of data input methods are as follows:
1. Manual:
- Manual data entry is done if the data are collected or measured data manually.
- The data exists as a text file or binary file.
2. Digitizing:
- It is the process of capturing data on a map and putting into a computer file.
- It can be manual or automatic.
- Manual digitizing allows geo-referencing during the digitization process.
- Automatic digitizing requires geo-referencing in later stages.
3. Scanning:
- A digital image of map is produced by moving an electronic detector across the surface of the map.
- The output is a digital image.
4. Remote Sensing:
- It is the science of making measurements of the Earth using sensors on satellites or airplanes.
- The sensors collect data in the form of images and provide capabilities to manipulate, analyze and view the images.
Map elements, map layers, map scales and representation
Map
- Map is a tool by which the spatial relationships are visualized.
- Map shows following characteristics:
1. True direction
2. True angle
3. True distance
4. True area
5. True shape
- Map is used for following purposes:
1. To record and store information
2. Analyze distribution and spatial patterns
3. Method to present information and communication findings
- The map consists of following features:
1. Point
2. Line
3. Area
Elements of a Map
1. Data Frame:
- It is the portion of the map that displays the data layers.
- It is the central focus of the map.
2. Legend:
- It serves as the decoder for various symbols used in the data frame.
- It is also known as key.
3. Title:
- Each map must have a title.
- It represents what the map is about.
- It helps users to identify the geographic phenomena represented by the map.
4. North Arrow:
- It is used to indicate the orientation of the map.
- It allows the users to determine the direction of the map.
5. Scale:
- It shows the relationships of the data frame extent to the real world.
- It indicates the ratio by the the map is scaled with respect to the real world.
Scale and Resolution of Map
- Scale of map refers to the ratio of distance on a map over the corresponding distance on the real world.
- It is represented as 1:M, where M indicates the scale denominator.
- The larger the scale, the more detail is described by the map with higher accuracy.
- Resolution of map is the smallest difference between adjacent positions that can be recorded.
- Resolution is tied to the scale of map.
- It limits the minimum size of feature that can be stored.
- Spatial resolution refers to the pixel size of the satellite images covering the Earth surface.
- The higher the spatial resolution, the more completely and precisely the shape of objects are sampled, the more accurately the objects can be identified based on shape and the more accurately the location and area of the objects can be determined.
- It has implications for:
1. how we define objects on the surface
2. scale of analysis
3. location precision and accuracy
4. purity of spectral response
5. data volume and data processing cost
- Spectral resolution refers to the number of spectral bands in which the sensors can collect the reflected radiation.
- The higher the spectral resolution, the more completely and precisely spectral signature of each object will be sampled and more accurately different elements in the area can be classified.
- Signal/noise ratio should be maintained while choosing spectral resolution.
- Temporal resolution refers to the revisiting frequency of the satellite sensor for a specific location.
- It indicates the frequency at which the given ground location will be sampled.
- The higher the temporal resolution, the more completely and precisely temporal signature of objects are sampled and more accurately the scene elements can be classified based on their temporal behavior.
Map Layer
- A map layer is a database containing groups of points, lines or area features representing a particular classes or type of real world entities.
- It contains visual representation of each feature and a link from the features to its database attributes.
- Maps are generally made by combining multiple map layers.
Coordinate system
- Coordinate system is the model that maps the Earth's surface to a plane.
- A coordinate system is a reference system used to represent the locations of geographic features, imagery, and observations, such as Global Positioning System (GPS) locations, within a common geographic framework.
- Geographic data should be geographically referenced in a common coordinate system.
- It enables geographic data to use common locations for integration.
Necessity of Coordinate System
1. To perform calculations about the distances, routes and so on.
2. To relate one feature with another.
3. To specify position of an object in terms of distance and direction from fixed point, line or surface.
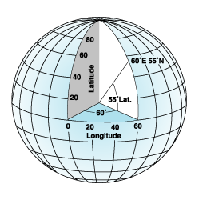
Geographic Coordinate System
- A geographic coordinate system (GCS) uses a three-dimensional spherical surface to define locations on the earth.
- It includes an angular unit of measure, a prime meridian, and a datum (based on a spheroid).
- A point is referenced by its longitude and latitude values.
- Longitude and latitude are angles measured from the earth's center to a point on the earth's surface.
- Data defined on a geographic coordinate system is displayed as if a degree is a linear unit of measure.
Projected Coordinate System
- A projected coordinate system is defined on a flat two dimensional surface.
- It includes map projection, parameters of map projection and a linear unit of measure.
UTM System
- UTM stands for Universal Transverse Mercator.
- It is based on Transverse Mercator projection.
- It is a conformal projection that uses two dimensional Cartesian coordinate system to give locations on the surface of the Earth.
- It is the horizontal position representation of the Earth's surface.
- It divides the Earth into 60 zones, each being a six degree band of longitude.
- Each of the 60 zones uses a transverse Mercator projection that can map a region of large north-south extent with low distortion.
- A position on the Earth is given by the UTM zone number and the easting and northing planar coordinate pair in that zone.
Spatial referencing: ITRS, ITRF
Spatial Referencing
- Spatial referencing is also known as geo- referencing.
- It is the representation of the location of real world features within the spatial framework of a particular coordinate system.
- It provides a rigid spatial framework by which the positions of the real world features are measured, computed, recorded and analyzed.
- Spatial reference system is the reference coordinate system with well defined origin and orientation of the three orthogonal coordinate axes.
- The commonly used spatial reference system are as follows:
1. International Terrestrial Reference System (ITRS)
ITRS and ITRF
- ITRS has origin in the center of mass of the earth.
- ITRS is realized through ITRF (International Terrestrial Reference Frame)
- ITRF is a catalogue of estimated coordinates at a particular epoch.
- They defines the vertices of a fundamental polyhedron of several specific and identifiable points.
- Frame maintenance refers to relating the rotated, translated and deformed polyhedron at later epoch to the fundamental polyhedron.
- Frame maintenance is necessary geographic phenomena tends to deform the earth's crust at measurable scale.
- ITRF describes the geometry and behavior in time of the objects near to or on the earth surface in terms of cartesian x, y and z coordinates and velocity.
Different classes of Map projections
Map Projection
- Map projection is defined as an attempt to portray the surface of the portion of the Earth on a flat surface.
- Map projection is a systematic transformation of the latitudes and longitudes of locations from the surface of a sphere or an ellipsoid into locations on a plane.
- It is the way to represent the spherical surface of the Earth on the two dimensional plane.
- The projection distorts the properties of the map (conformality, distance, direction, scale or area).
- The projection should be done such that the effects of the distortion is minimal.
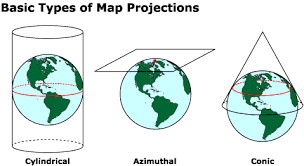
Classification of Map Projection
1. Cylindrical Projection:
- It circumscribe a transparent globe so that the cylinder touches the equator throughout its circumference.
- It is obtained by cutting the cylinder along the meridian and unfolding it to get a rectangular shaped cylindrical projection.
2. Conical Projection:
- A cone is placed over the globe such that the apex of the cone is exactly over the polar axis.
3. Azimuthal or Planar Projection
- A plane is placed so that it touches the globe at the north and south pole.
- It is circular in shape with meridians projected as a straight lines radiating from the center of the circle.
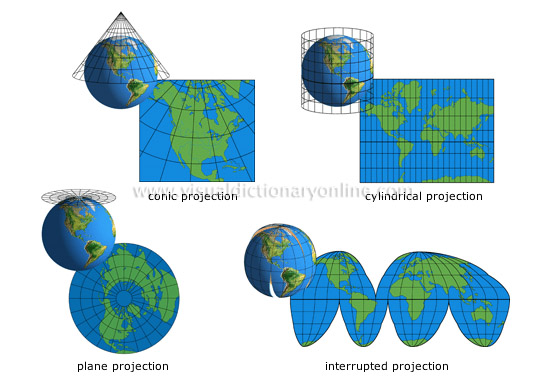
The output of different map projections are shown in given figure:
Datum and Datum Transformation
Datum
- Datam is a set of parameters defining the coordinate system and a set of control points whose geometric relationships are known.
- It is defined by a spheroid which approximates the shape of the Earth and its position relative to the center of the Earth.
- It is used to locate places on the Earth.
- It is used to create starting or reference points for various works requiring the accurate coordinates that are consistent to each other.
- Horizontal datum is used through a collection of specific points on the Earth whose latitude and longitude have been accurately determined.
- Vertical datum is used through a collection of specific points on the Earth with known heights either above or below the nationally defined reference surface.
Datum Transformation
- Datum transformation is the set of mathematical formula that converts point coordinates from one datum to another.
- It provides tools that enable the users to transform coordinates of spatial objects from the new datum to the old one.
- The tools are known as datum transformation parameters.
- The transformation from datum A to datum B is a mathematically straight forward process.
- It is a transformation between two orthogonal cartesian spatial reference frames together with some elementary tools.
- The datum transformation requires knowledge about the relationships in terms of position and orientation, defined by 7 constants (3 distances of the datum center from the center of the earth [Δx, Δy, Δz], 3 rotations around the x, y and z of the cartesian coordinate system axes and 1 scale change (S) of the survey control network).
GPS& Remote Sensing
Global Positioning System (GPS)
The elements of GPS are as follows:
1. Space segment
- It consists of the GPS satellites which sends radio signals from the space.
- The satellite repeat the same track and configuration over any point approximately each 24 hours.
- There are 6 orbital planes equally spaced and inclined at about 55 degree with respect to equatorial plane.
- Each orbital plane consists of 4 GPS satellites.
2. Control segment
- It consists of the system of tracking stations located around the world.
3. User segment
- It consists of the GPS receiver and the users.
- GPS receiver converts the signals from GPS satellite into position, velocity and time estimate.
- Four satellites are required to compute the four dimensions (x, y, z position and time)
Remote Sensing
- It accomplish information transfer with the help of electromagnetic radiation.
- Electromagnetic waves are radiated from the space.
- When it encounters an object, either it is reflected or absorbed or transmitted.
- The total amount of energy that strikes the object is called incident radiation
Incident radiation = Reflected radiation + Absorbed radiation + Transmitted radiation
Quality aspects of spatial data
Data Quality
- Data quality is the degree of data excellency that satisfies the given objective.
- Data quality should be maintained to produce better results.
Aspects of Data Quality
1. Completeness:
- It is the measure that indicates that all the necessary features are available.
- It is not always possible to have a complete features.
- So, the data set having minimal amount of missing features can be termed as complete data.
2. Precision:
- It is the measure that refers to the degree of details that are to be displayed on a uniform space.
3. Accuracy:
- It is the measure that shows how accurate the data is with respect to real world.
- It indicates the discrepancy between the actual attributes value and collected attributes value.
4. Consistency:
- It refers to the absence of the conflicts within the database that stores the spatial data.
Sources of Data Discrepancy
- Data discrepancy leads to inaccurate data. The sources of data discrepancy are as follows:
1. Data information exchange
2. Data capture
3. Carthographic effects
4. Data transfer
5. Metadata
Improve Data Quality
1. The relevant data should be collected from the relevant sources.
2. The precision should be derived in the origin.
3. Data quality testing should be done in each phase of the data capture.
4. Data validation should be done.

Ⓒ Copyright ESign Technology 2019. A Product of ESign Technology. All Rights Reserved.